

From Unknown to Millionaire: The Price Action Method That Still Works Today
How Two Simple Lines On A Chart Built A Seven-Figure Forex Account

The Pattern That Separates Professional Traders From Everyone Else

Four years ago, I was nobody in the forex world.
No hedge fund background. No Wall Street connections. No proprietary algorithms or insider access.
Just a $100,000 account, a simple price action method, and the discipline to execute it consistently.
Today, that account is worth over $1.4 million.
The strategy hasn’t changed. The market dynamics haven’t changed. What changed was my understanding of how professional money actually trades forex.
Let me show you the exact price action method I used, why it continues to work in today’s markets, and how you can apply it to the three most profitable currency pairs I trade: GBP/USD, AUD/USD, and GBP/CAD.
The Discovery That Changed Everything
I spent my first two years in forex losing money.
Tried everything. Fibonacci retracements. Support and resistance zones. Candlestick patterns. Elliott Wave. Harmonic patterns.
I’d win a few trades, get confident, then give it all back plus more.
The breakthrough came when I stopped trying to predict where price was going and started simply following where it was already going.
Sounds obvious, right? But most traders don’t actually do this.
They try to catch bottoms. They fade trends. They look for reversals instead of continuations.
I did the opposite. I found a way to identify when a currency pair was in a clear trend, then waited patiently for it to pull back so I could join that trend at a better price.
That’s it. That’s the entire edge.
Identify trend. Wait for pullback. Enter when price returns to support. Ride the trend.
Simple? Yes. Easy? Not even close.
The Price Action Framework: Two Moving Averages
Here’s what I discovered works better than anything else I’ve tested:
Two exponential moving averages. The 8-period and the 21-period.
Why these two specifically?
The 8 EMA reacts quickly to price. It shows you immediate momentum and helps you see when a pullback is ending.
The 21 EMA moves slower. It represents the institutional timeframe roughly one month of trading. When price respects this level, you know smart money is participating.
Together, they create a framework that answers three critical questions:
Is there a trend? (Price above or below both EMAs)
Is the trend strong? (EMAs separated and sloping clearly)
Where should I enter? (Pullbacks to either EMA)
No indicators needed beyond these two lines. No confusion. No paralysis by analysis.
How To Read The Trend (The Foundation)
Before you take any trade, you need to know what the trend is doing.
Uptrend Confirmation:
Price is trading above both the 8 EMA and 21 EMA
The 8 EMA is positioned above the 21 EMA
Both moving averages are angling upward
When all three conditions are met, you’re in an uptrend. This is your green light to look for buying opportunities.
Downtrend Confirmation:
Price is trading below both the 8 EMA and 21 EMA
The 8 EMA is positioned below the 21 EMA
Both moving averages are angling downward
When these three conditions align, you’re in a downtrend. Look for selling opportunities.
No Trade Zone:
Moving averages are flat or tangled together
Price is chopping between the EMAs
No clear separation between the two lines
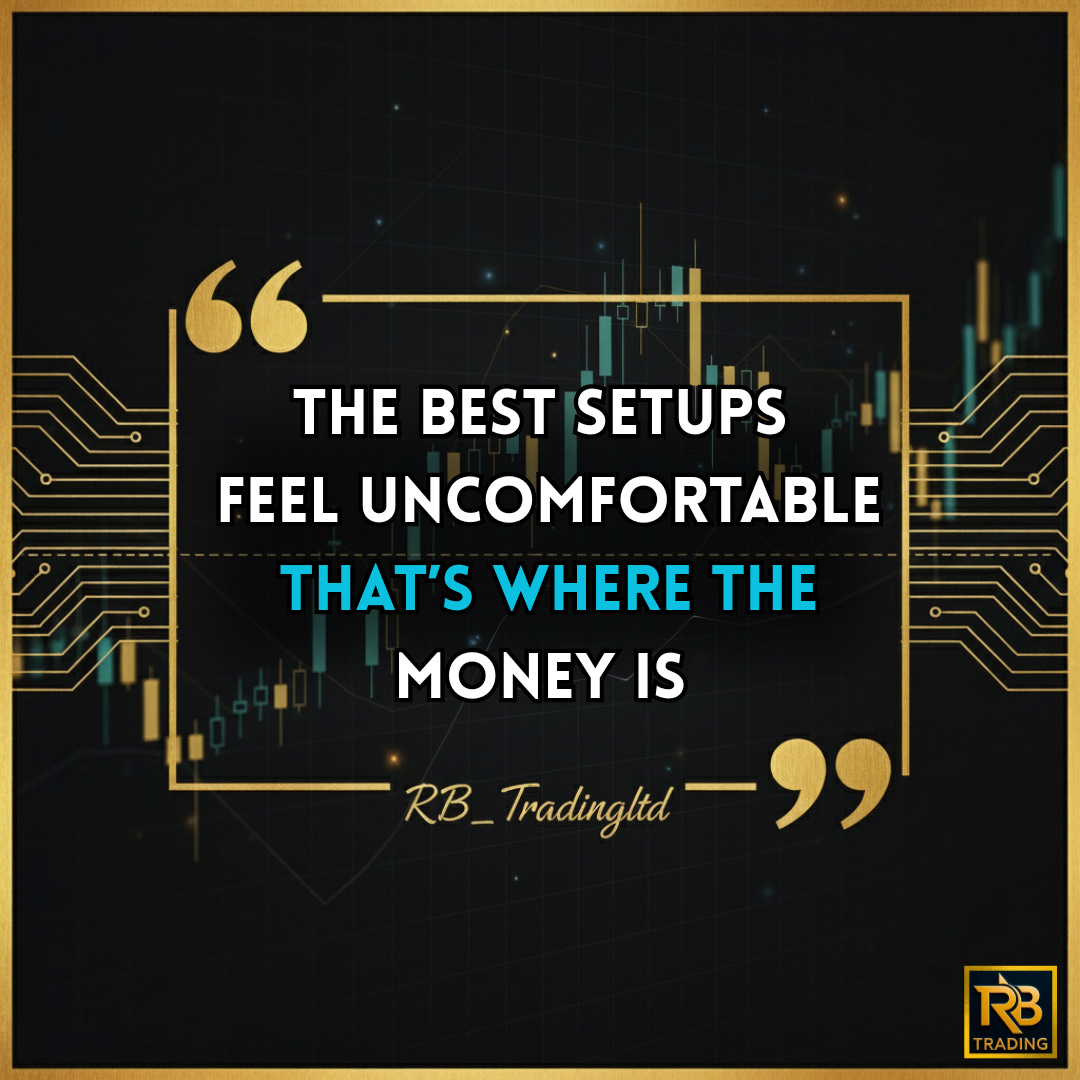
This is where most traders lose money. They force trades when there’s no clear trend. I learned to simply wait. If the setup isn’t obvious, there is no setup.

The Three Entry Types (Where You Actually Make Money)
Once you’ve confirmed a trend, you need a specific entry trigger. Here are the three I use:
Entry Type 1: The Shallow Pullback (8 EMA)
In strong trends, price barely pulls back. It touches the 8 EMA and immediately bounces.
This entry requires speed. The trend is powerful, and hesitation means missing the move.
What I look for:
Strong uptrend confirmed
Price pulls back and touches the 8 EMA
Bullish reversal candle forms at the 8 EMA (engulfing pattern, hammer, or strong close)
Volume increases on the reversal candle
Trade setup:
Entry: Just above the reversal candle high
Stop: 20-30 pips below the 8 EMA
Target: Previous swing high or next resistance
Why it works: You’re catching momentum early. The trend hasn’t paused long enough for doubt to creep in. Buyers are aggressive.
Entry Type 2: The Deep Pullback (21 EMA)
This is my highest probability setup and where I size positions largest.
Price pulls back deeper, testing the 21 EMA. This is where institutional money tends to add to positions. The deeper pullback shakes out weak hands, then smart money steps in.
What I look for:
Clear uptrend confirmed
Price pulls back and touches or slightly penetrates the 21 EMA
Price consolidates at the 21 EMA for 2-4 candles (buyers and sellers in equilibrium)
Strong bullish reversal candle closes back above the 21 EMA
Trade setup:
Entry: Just above the reversal candle high
Stop: 30-40 pips below the 21 EMA
Target: Previous high + 50-100 pips (trends often make new highs after holding the 21 EMA)
Why it works: You’re buying where big money buys. The consolidation at the EMA shows sellers exhausted their pressure. The breakout candle confirms buyers are back in control.
Entry Type 3: The Zone Bounce
Sometimes price doesn’t quite reach either moving average. It pulls back into the “zone” between the 8 and 21 EMAs.
This is the least clear-cut entry, so I use smaller position sizes.
What I look for:
Uptrend confirmed
Price pulls back into the zone between EMAs without touching either
A strong bullish candle forms in the zone
The 8 EMA begins to curve back upward toward price
Trade setup:
Entry: Above the reversal candle
Stop: Below the 21 EMA
Target: Previous high
Why it works: Sometimes. The win rate is lower (around 60%) but when it works, you’re getting in early before price even reaches the obvious support level.
The stock example
The Two Moving Averages That Turned $100K Into $1M

The Pattern That Wall Street Hides In Plain Sight
Why Forex? Why These Pairs?
Before I show you specific examples, let me explain why forex is ideal for this method.
Leverage Without Gambling
Forex offers leverage that stocks can’t match. Most brokers provide 50:1, some international brokers offer up to 500:1.
Used responsibly, this accelerates wealth building. A $100K account with 5:1 leverage controls $500K. Your gains compound faster.
The key word: responsibly. I never use more than 10:1 leverage, usually 5:1.
True 24-Hour Markets
You can trade London open, New York session, or Asian hours. Flexibility that stock traders don’t have.
This means setups develop around the clock. You’re not limited to 9:30am-4pm EST.
Trending Nature
Currency pairs trend beautifully when central banks diverge on policy, economic data shifts, or risk sentiment changes.
These trends can run for weeks or months. Perfect for a pullback entry strategy that requires extended trends.
The Three Pairs I Focus On
I don’t trade everything. I specialize in three pairs that trend cleanly and respect technical levels:
GBP/USD (Cable) - Liquid, volatile, trends strongly when UK and US economic data diverge. Professional pair.
AUD/USD (Aussie) - Commodity-correlated, clean trends, responds to risk-on/risk-off flows. Forgiving for newer traders.
GBP/CAD - Explosive when it trends, influenced by oil prices and UK/Canada rate differentials. For aggressive traders.
Master these three. Don’t jump around chasing every pair that moves.
Real Example: GBP/USD Breakdown
Let me walk you through a real trade setup on Cable.
GBP/USD - The British Pound vs US Dollar
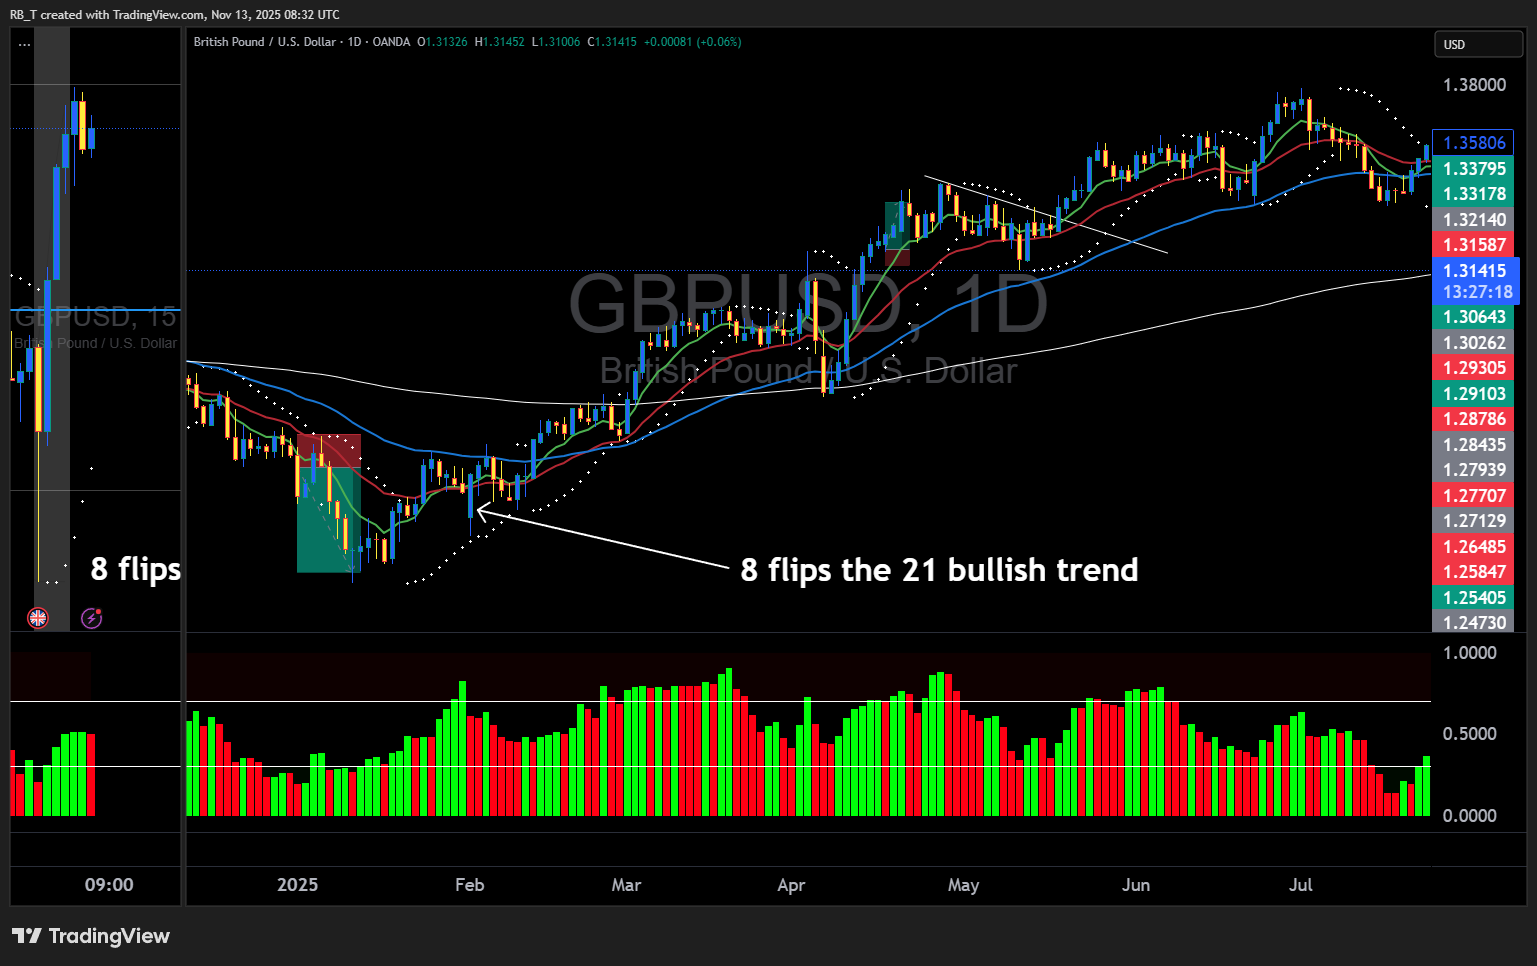
This pair moves on interest rate differentials between the Bank of England and Federal Reserve, plus Brexit-related flows and UK economic data.
The Setup I Took:
Keep reading with a 7-day free trial
Subscribe to Inside the Trade: to keep reading this post and get 7 days of free access to the full post archives.