


Good morning future millionaires lets jump into the Sunday pre market plan for next week.
Here’s what’s in this one.
→ Seven triggers published on 6 September. Four fired, I took four, and I’ll name the three I left.
→ Two of this week’s three new names already stopped me out. One of them eleven days ago.
→ PayPal against Microsoft. Same scan, same rules, two opposite answers, and why one of them is a trap that looks like value.
→ The 900. What the Portfolio Builder actually does every week, and why most of what it finds gets thrown away.
→ Why I build these. What the desk, the journal and the scan were each meant to take off you.
→ The board. Three new setups, a stop moved to break-even, and a Fed meeting on Wednesday.

The three-gate line
The trend gate passed. The momentum gate passed. The risk gate failed, so I left it alone and wrote down why. It ran anyway. I’d make the same call again on Monday, because the alternative is a rule I only follow when it agrees with me.
1. The promise I made a week ago, and what happened to it
On Sunday 6 September I published seven setups that hadn’t triggered yet, with the trigger price written next to each one, before the open. I said in that letter I’d come back and tell you which ones I actually took.
Four of the seven fired and I’m in all four. GBP/NZD, AUD/CAD, WULF and BTDR.
Three never got taken. GBP/USD, IREN and SOL.
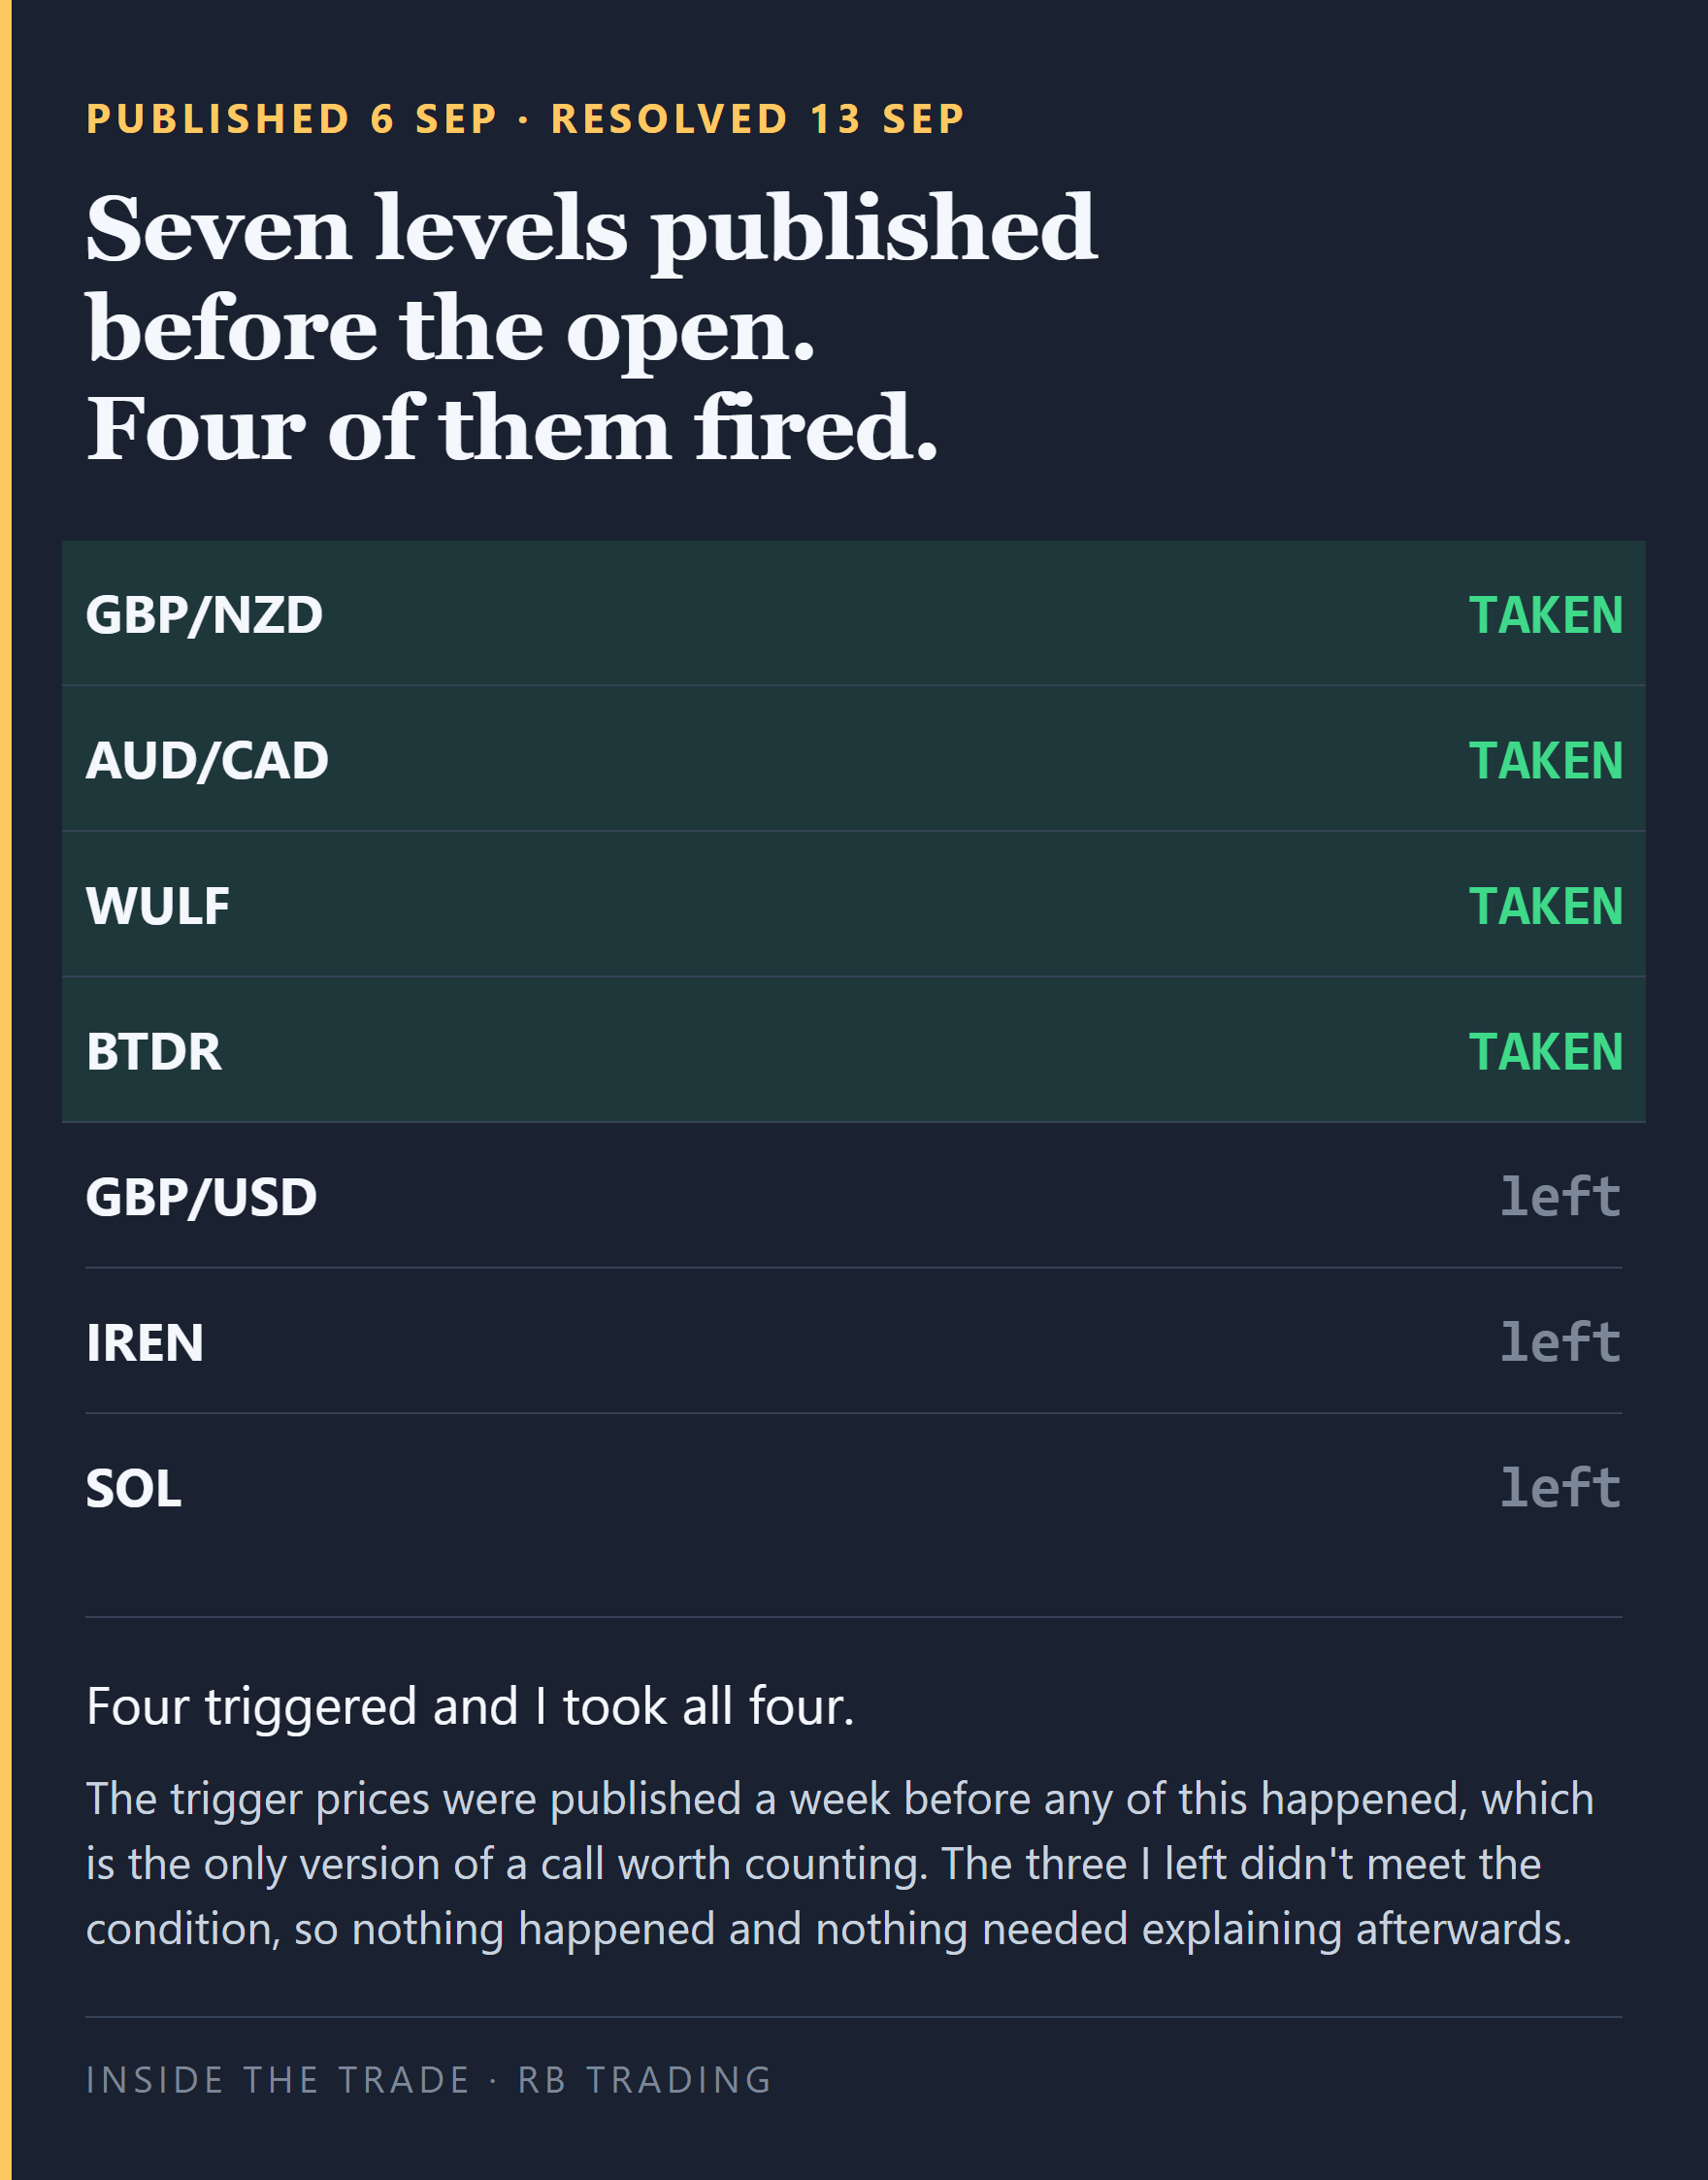
Two of those four were sitting a tenth of a percent from their trigger when I published them. I wrote at the time that GBP/NZD “probably does tag its trigger this week.” It did, and I took it. That’s the least impressive way to be right, and I’ll take it, because the point was never the forecast. The point was that the level was written down and public before it happened, so neither of us gets to reinterpret it afterwards.
The one worth flagging is IREN, because it’s the interesting failure. It stopped me out on 28 August at a full −1R. Eight days later it was back on my pending board at a lower trigger. It never tagged that trigger, so nothing happened, and I got to keep the question hypothetical. This letter is about what I’d have done if it hadn’t stayed hypothetical.
2. The record, all of it, including the ugly half
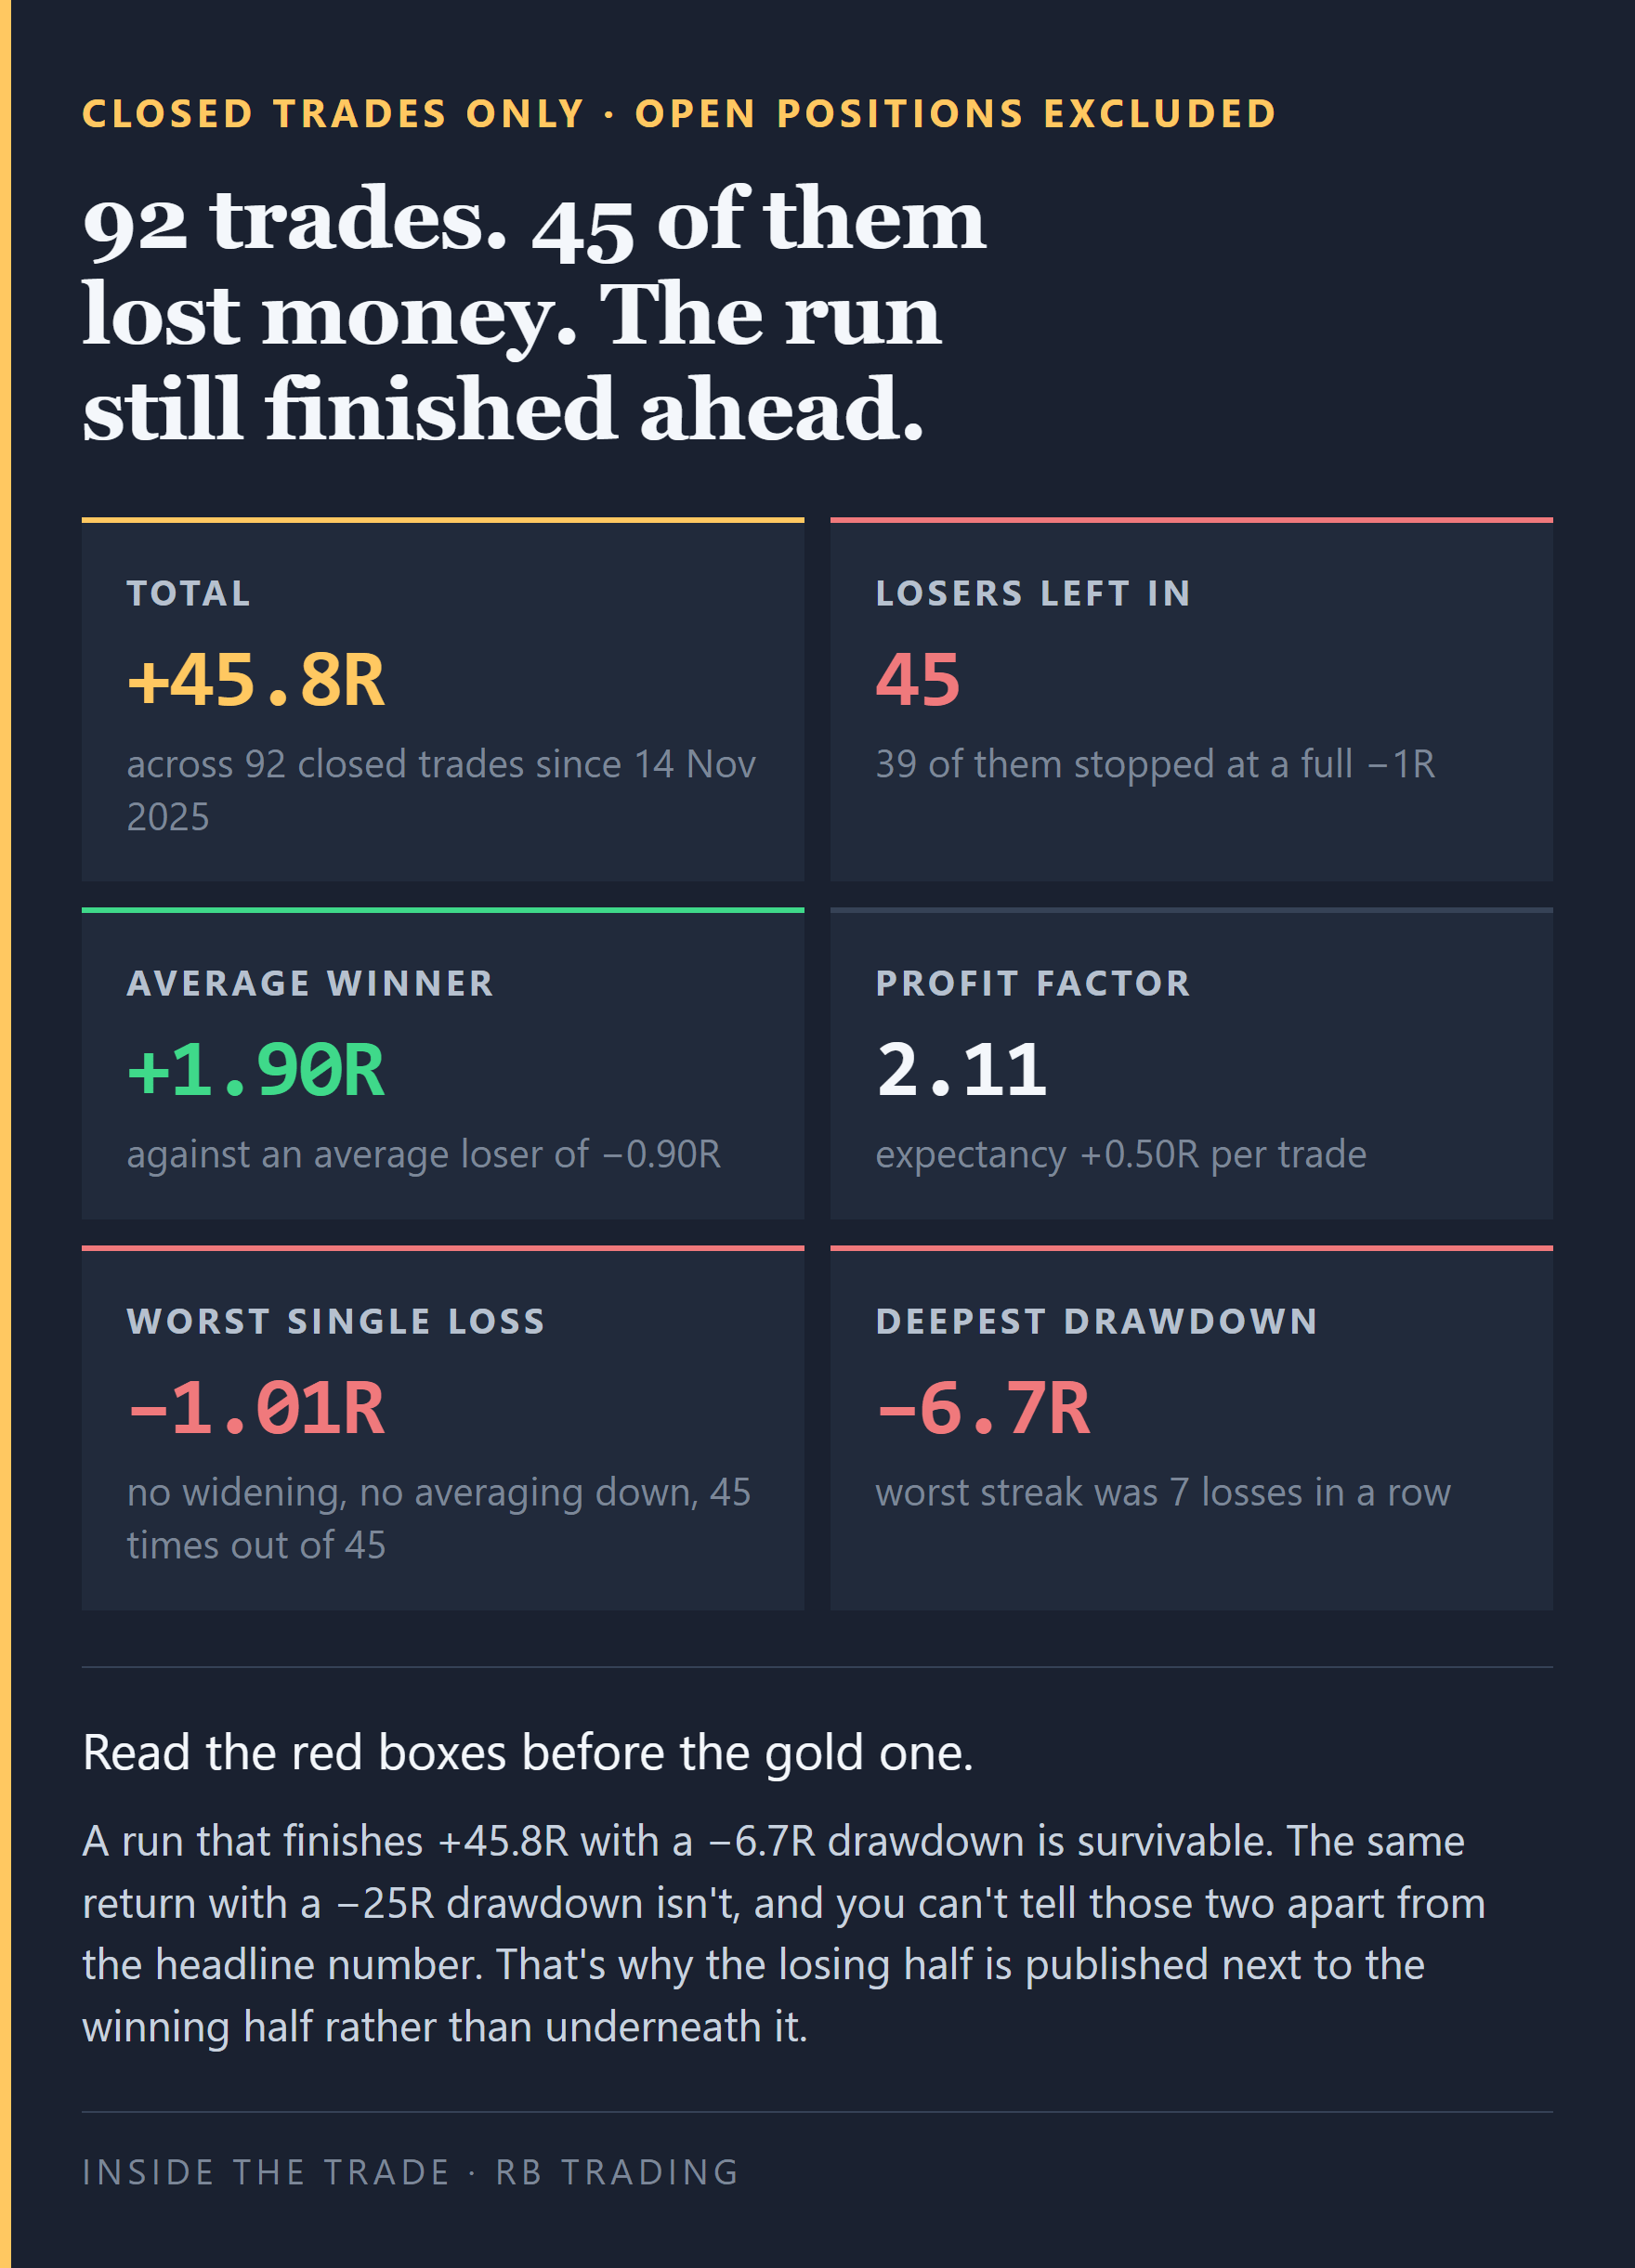
If you only read half of that table, read the bottom half. It’s the half I went looking for when I was starting out and could almost never find, because nobody puts their drawdown next to their return. Forty-five of those 92 trades lost money. Thirty-nine stopped at a full −1R. The worst single loss across the entire run was −1.01R, which is the stop doing its job every single time, with no widening and no averaging down.
That number matters to a long-term investor as much as it does to a prop trader, and it’s the one nobody posts. A run that finishes +45.8R with a −6.7R drawdown is survivable. The same return with a −25R drawdown isn’t, and you’d never tell the difference from the headline.
Every row is public with its entry, stop, exit and R beside it, including the seven straight losers, at tradedesk.rbtrading.site/track-record. If a number in the R column doesn’t match the three prices next to it, tell me and I’ll fix it.
3. What happened this week?
Friday’s CPI ran hot on the headline and soft underneath it, and the overshoot was almost entirely energy with oil around $104. Core eased from 2.5% to 2.4%. The payrolls print the week before came in at +162,000 against a consensus nearer +53,000. Both are in the Bureau of Labor Statistics releases and both got covered properly in Friday’s letter, so I won’t re-run the arithmetic here.
What matters for this board is the calendar. The FOMC meets Tuesday and Wednesday, 15 and 16 September, and announces Wednesday afternoon. That’s from the Federal Reserve’s own published calendar, not my read of it.
So every long on this board is a long into a decision nobody can price with confidence. That’s a sizing question before it’s a stock-picking question.
4. The market state, four gauges
Risk on or off. On, but narrowly. Leadership is the same large-cap technology complex it’s been for a year, and my open book reflects that more than I’d like.
Where the crowd is. Crowded in the megacaps and crowded in the bitcoin-adjacent miners. I’ve got exposure to the second one and I’m aware that’s a crowd rather than an edge.
The overlooked corner. Beaten-down payment and fintech names, which is exactly where the PayPal chart below comes from, and where my answer this week is still no.
The 3-Gate verdict. Trend passes, momentum passes, risk is the gate carrying all the weight into Wednesday. Everything new on this board gets sized off the stop distance rather than off conviction.
5. “It stopped me out, so it owes me one”
Nobody says that sentence out loud. Plenty of us act on it.
Two of the three new names on this board already took my money this quarter. One of them eleven days ago. That’s not a coincidence, and I’d rather walk you through it while it’s live than explain it afterwards. The reasoning that takes you back into a name is either a setup or a grudge, and from the inside those two feel exactly the same, which is the only reason this is hard.
Call it the owed trade. It’s the position you take because a name is holding money you think of as yours, rather than because the conditions that made it a setup have re-formed. The tell is in the arithmetic rather than the feeling. An owed trade almost always has a worse reward-to-risk than the original, because you’re entering higher after a bounce and you refuse to widen the stop, and you accept that worse number without noticing you’ve accepted anything at all.
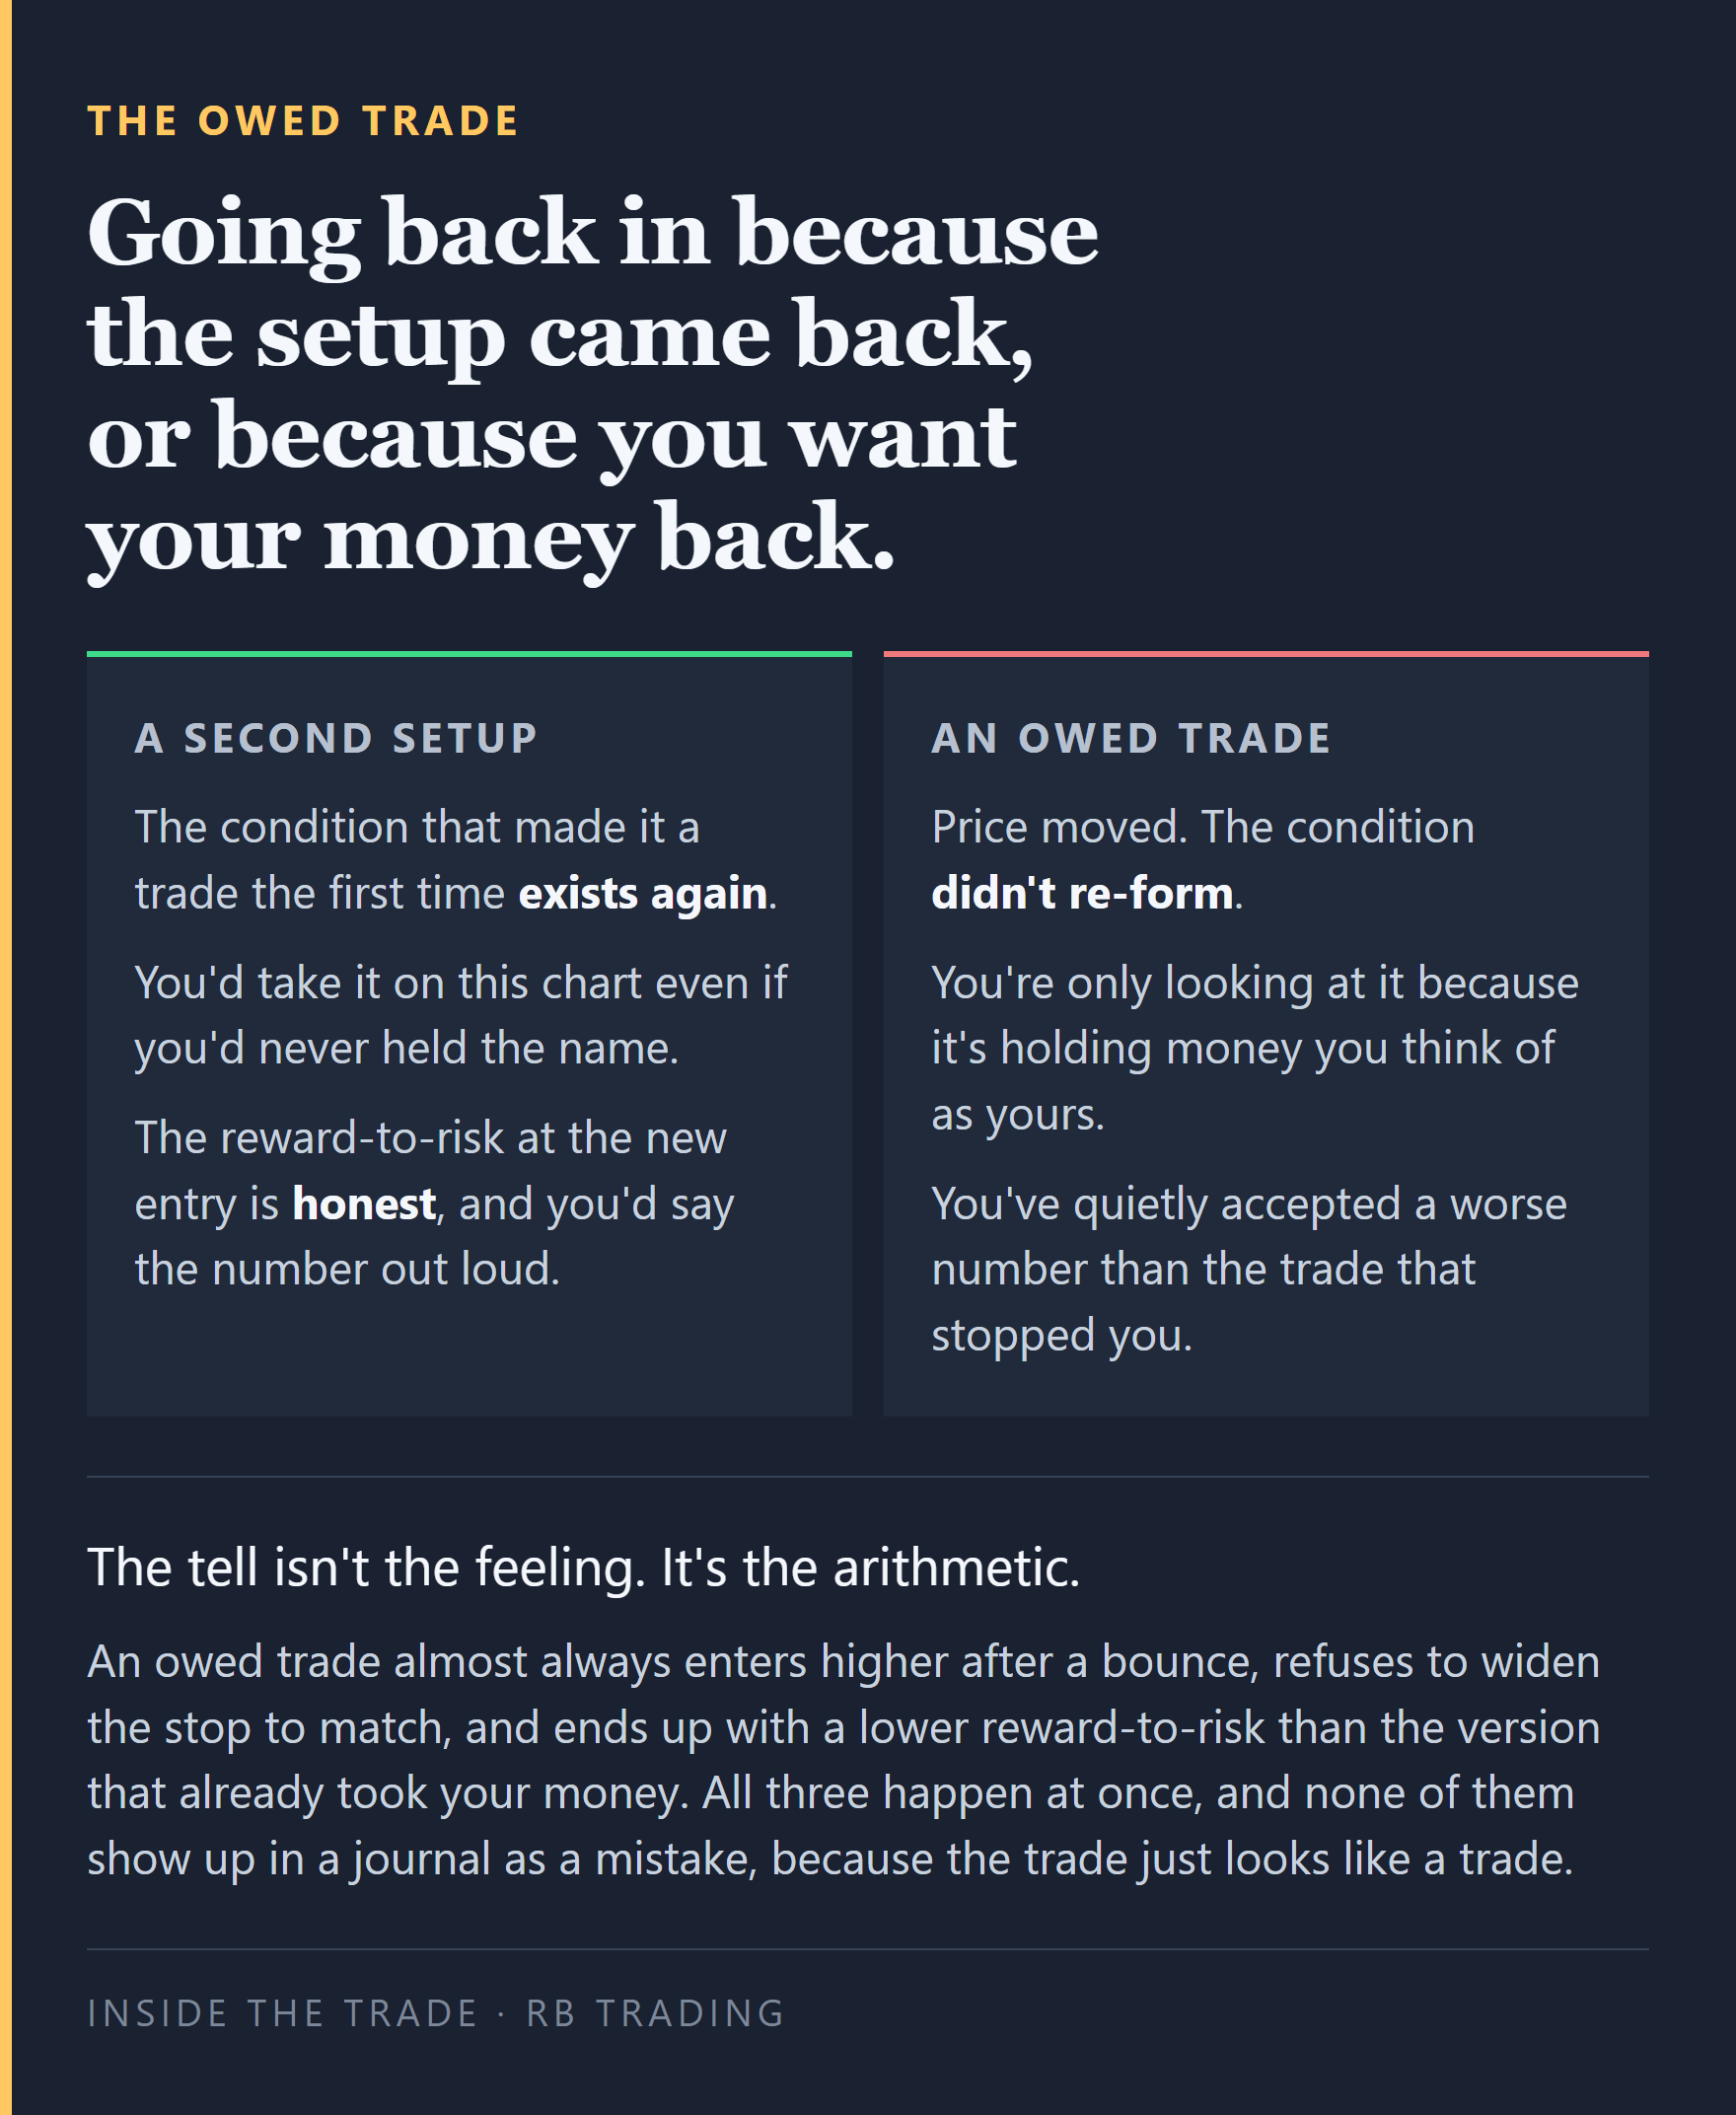
Here’s the uncomfortable part. Both of my re-entries this week carry exactly that signature. Higher entry than the trade that stopped me, tighter stop than the trade that stopped me, and a lower reward-to-risk than the trade that stopped me. All three new setups sit between 2.0R and 2.1R, where the versions that stopped me were between 2.4R and 2.5R.
I’m still taking them. The full numbers are below the break and you can judge the reasoning yourself. But I’d rather show you the pattern and let you argue with it than present two re-entries as fresh ideas and hope nobody checks the record.
6. “But surely a cheap stock in a real business is a buy”
This is the objection I get most from the longer-term readers, and it’s why the two charts in this section are here.
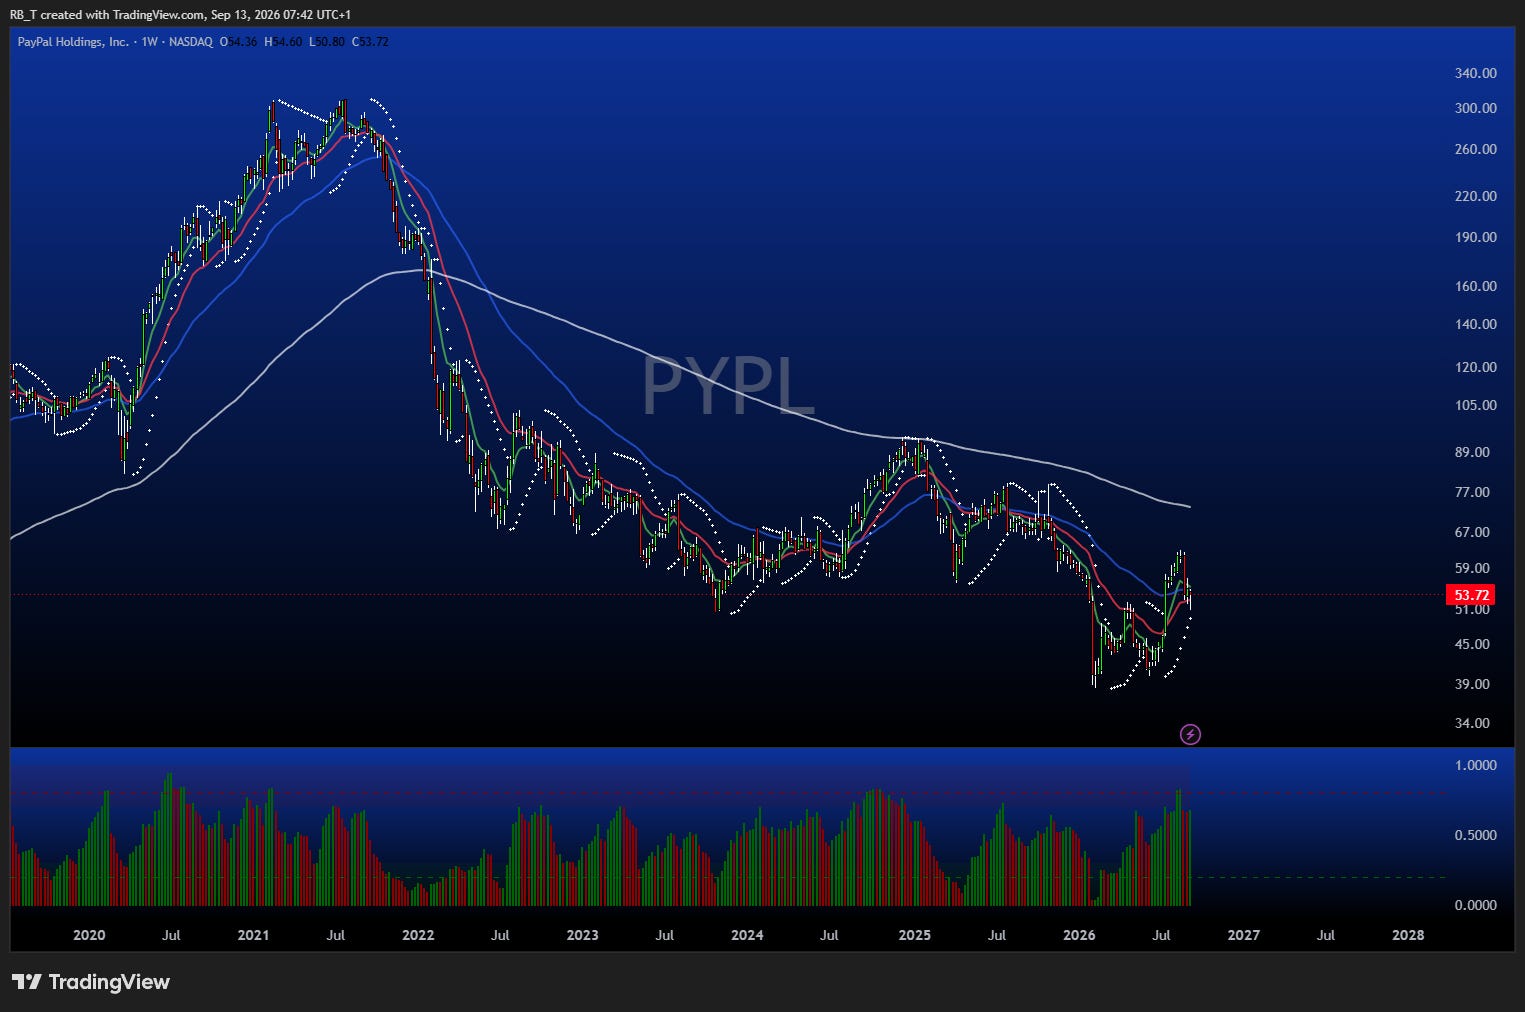
That’s PayPal on the weekly. Real company, real revenue, down from over $300 to the low fifties. Every value screen in the world flags it. It fails my scan, and it fails on one thing: the 200 week EMA is falling and price is underneath it.
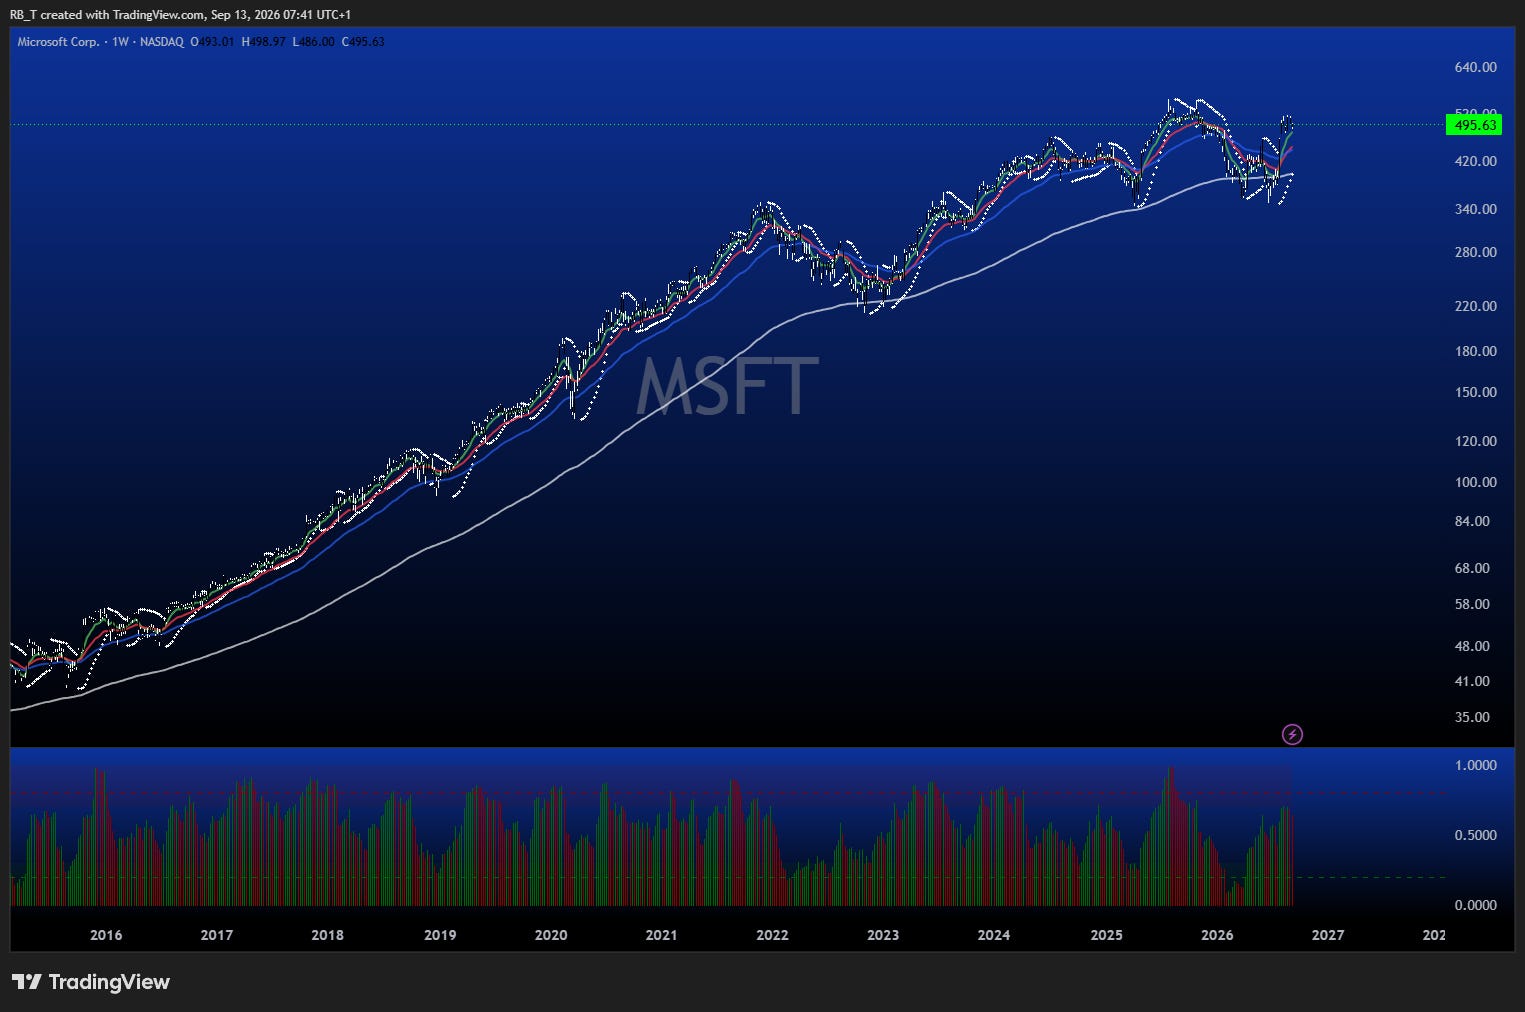
That’s Microsoft on the same timeframe with the same lines on it. The 200 week EMA is rising, price sits above it, and the pullbacks keep getting bought at the shorter EMAs. Same scan, same rules, opposite answer.
I’m not showing you Microsoft because it’s a clever call. The desk took it long from $385 to a $481 target back in August for +2.91R, that trade closed on 8 August and it’s already been through a previous letter, so it isn’t new proof and I’m not presenting it as any. I’m showing you the chart because it’s the cleanest picture I’ve got of what the rule is actually looking at.
The difference between those two charts isn’t the quality of the business and it isn’t the price. It’s the direction of the long-term average and which side of it price is sitting on. PayPal might well be a wonderful business at $53.72. It’s still a falling knife by the only test I’ll act on, and “it’s a good company” has never once been the reason my stop didn’t get hit.
7. So what does earn a name a second attempt?
These are the three I ask myself, and I’m not handing them over as a rule so much as showing you the one I actually use. A re-entry has to pass all three. It’s the same set whether you’re going back in after two weeks or after two years.
Has the setup re-formed, or has the price just moved? A bounce isn’t a setup. The condition that made it a trade the first time either exists again or it doesn’t.
Would you take it if you’d never held it? This is the one that catches the owed trade. Show the chart to someone with no history in the name and watch whether they reach for it.
Is the reward-to-risk honest at the new entry? Not “still acceptable.” Honest. If the number has dropped and you’re taking it anyway, say out loud why, and if the answer is that you want the money back, that’s your answer.
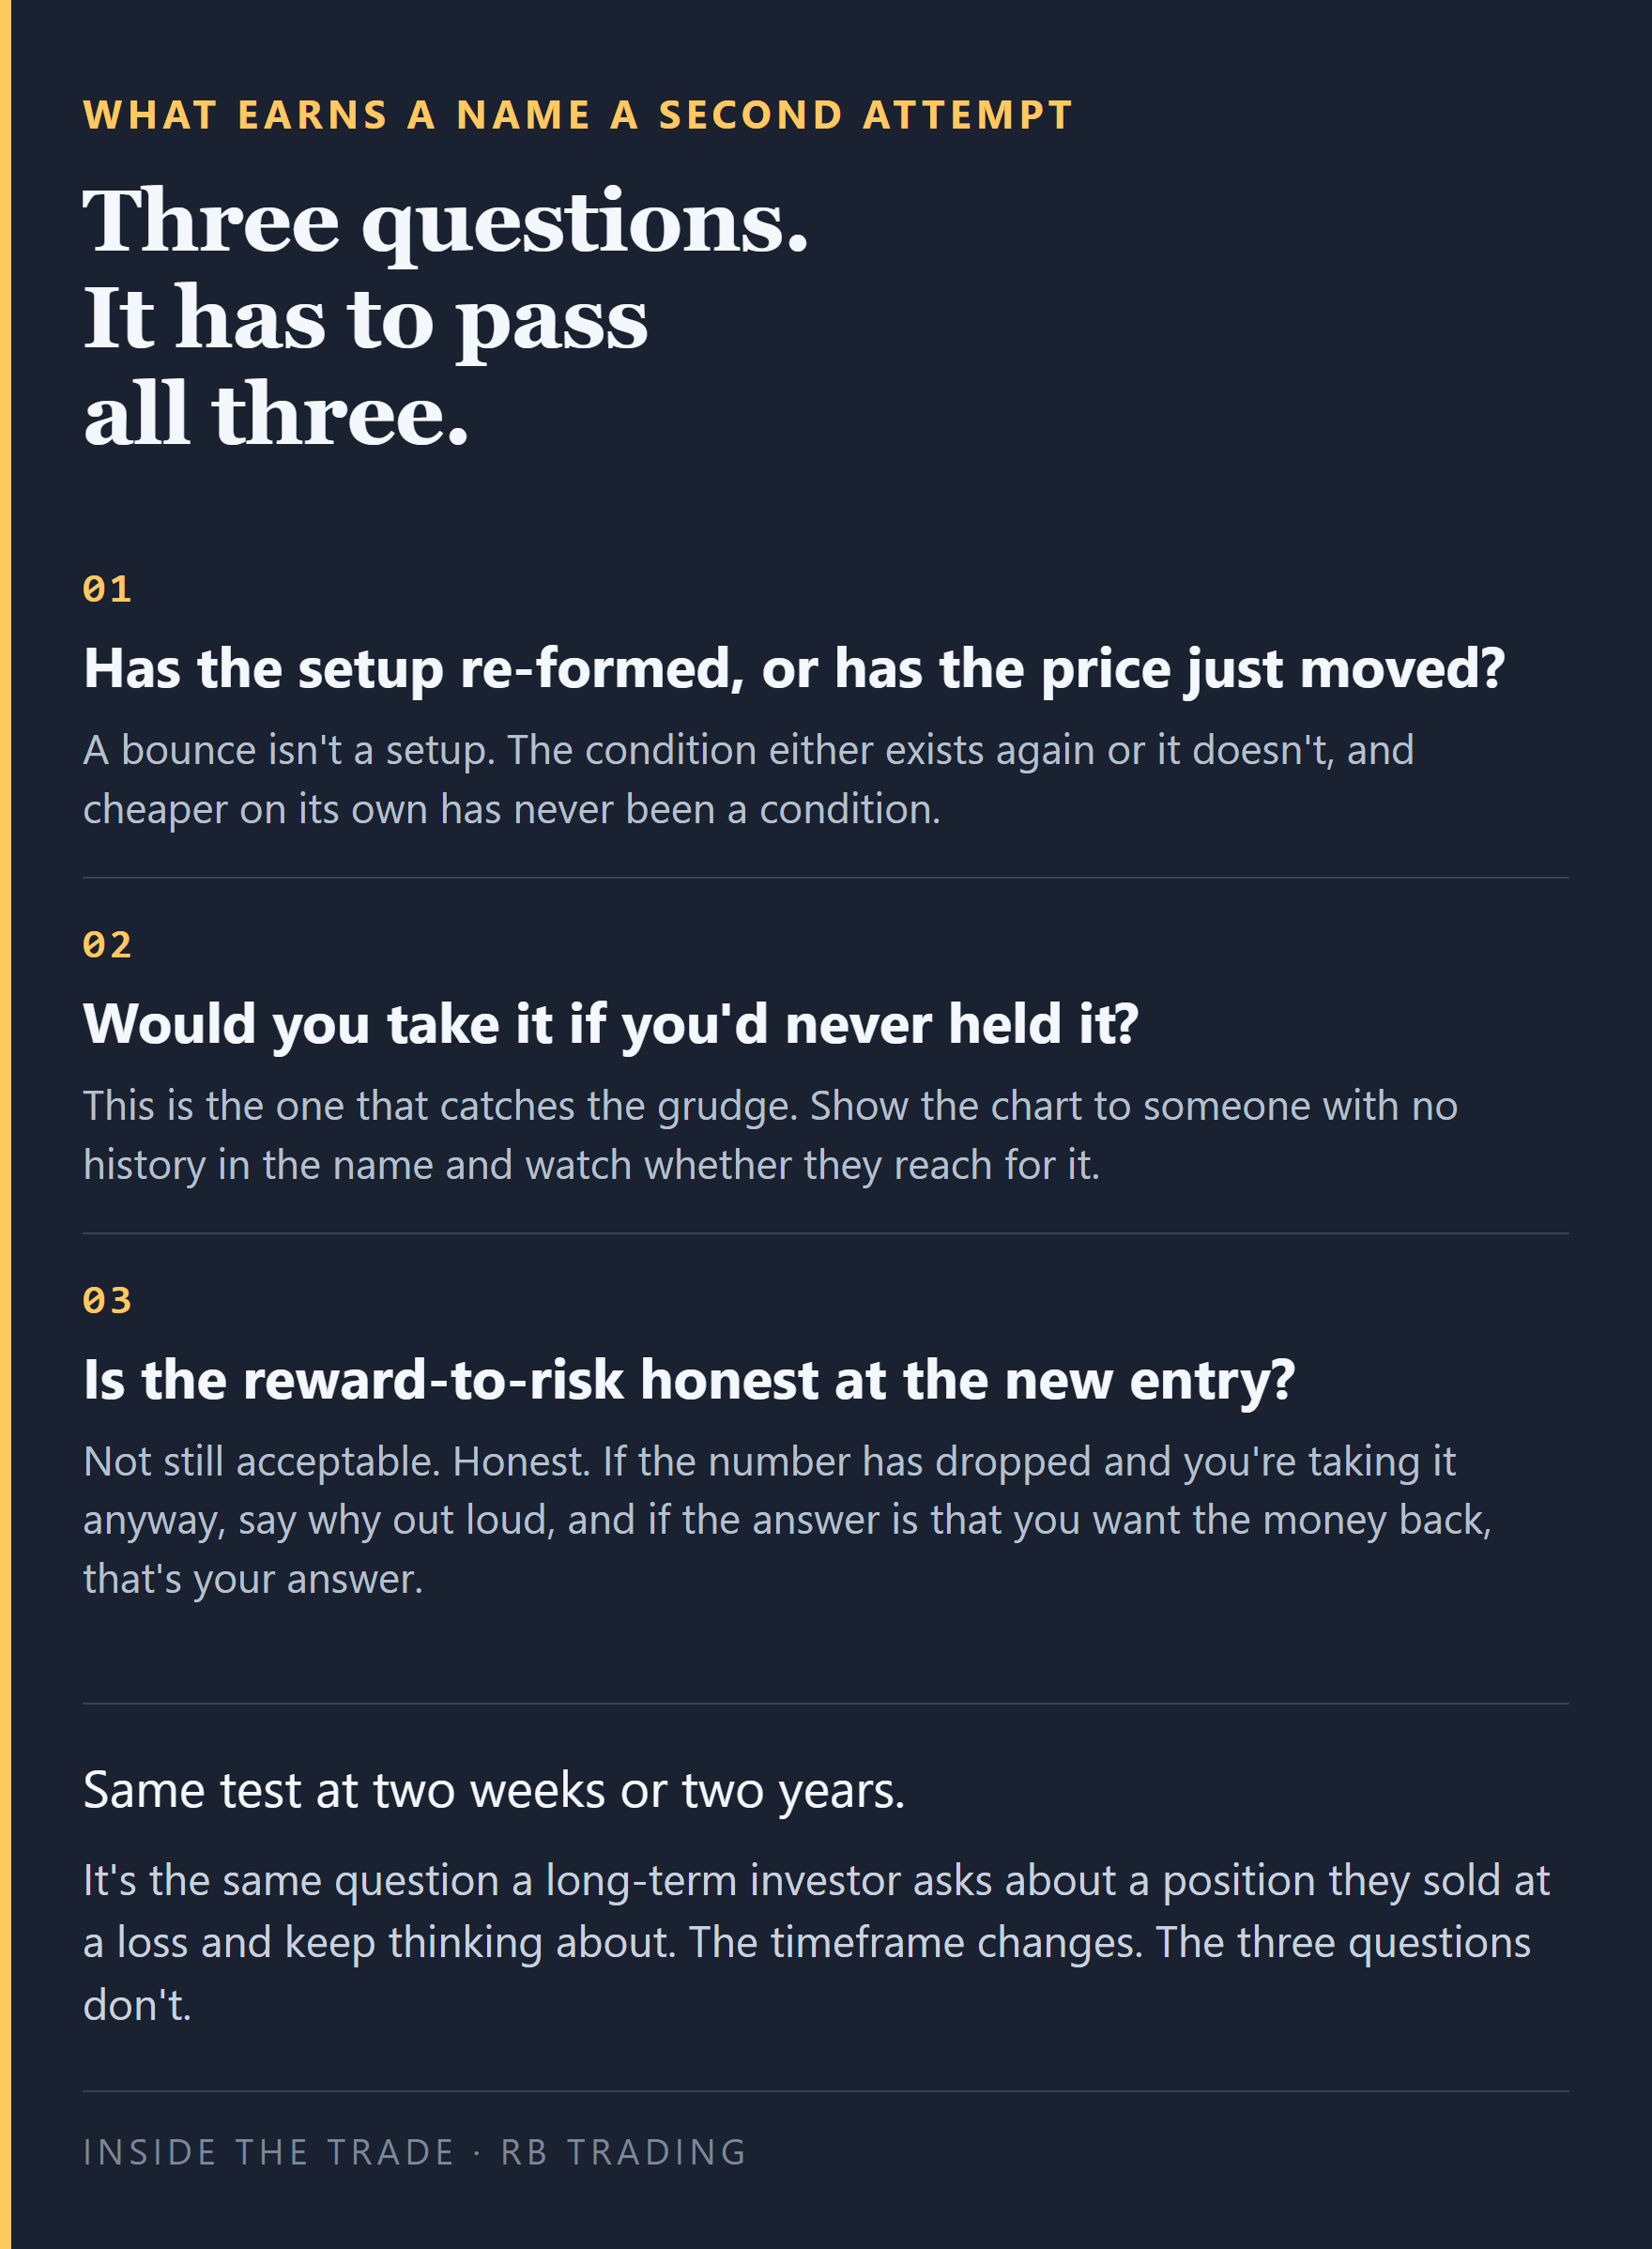
My two re-entries pass one and two. Three is the one I’ve had to argue with myself about, and you’ll see the exact numbers below.
If you want to run that third question on something of your own, you don’t have to do the arithmetic in your head. Reward-to-risk is the exit minus the entry, divided by the entry minus the stop, and I’ve put a free calculator up that does it and shows you the win rate each R level needs just to break even. No signup, nothing to install.
Put your last re-entry through it, the one you already took. That’s the version of this worth doing, because it tells you something about a decision you’ve already made rather than one you’re about to.
8. The 900
The Portfolio Builder runs the same scan across more than 900 companies every week. Not a watchlist, not a shortlist somebody curated, the whole set, every week, same rules.
Most of what comes back gets thrown away, and that’s the useful part. PayPal is in that 900. So is Microsoft. The scan doesn’t have an opinion about either of them, it just applies the test and sorts them. What you saw in section 6 is the two ends of the same output.
This is the part that matters most if you’re investing rather than trading. You don’t need to watch a screen to use a weekly scan. You need one rule applied the same way to every name, run on a schedule, across enough of them that you’re not just confirming the forty you already liked.
Which is the honest reason it exists. Reading 900 charts on a Sunday would ruin your Sunday. Something has to read them so you don’t have to, and then you only look at the handful that actually came back.
9. Why I build any of these things
I built these tools because I needed them myself they make my life easier they filter the noise out and let me ignore whats broken with a simple click.
Everything on the desk started as something I was doing badly by hand. The board exists because I kept making the decision at the screen instead of the night before. The journal exists because I kept misremembering my own trades in my own favour, and always generously. The scan runs across 900 names because left to myself I’d look at the same forty I already had a view on.
None of it is there to make you work harder at this. It’s there to move the work to a calmer moment. A level written down on Sunday is one you don’t have to find on Wednesday while the number’s moving. A rule that runs across 900 names is 900 decisions you didn’t have to sit and make. And a journal that keeps your first attempt next to your second one saves you an argument with your own memory that you would probably lose.
That’s what I’m actually trying to build here. Fewer decisions, and the ones that are left made earlier, when nothing’s moving and you’re not under any pressure to be clever. You don’t have to be at a screen all day to get good at this. Most of the people who are at a screen all day aren’t doing better for it, they’re just tireder.
10. One question, and I do read the replies
Hit reply and tell me one thing, because I genuinely want to know how common this is: have you ever gone back into a name that stopped you out, and when you did, was it because the setup came back or because you wanted the money back? There’s no wrong answer to that. I’ve done both, and I’ve only been honest with myself about it some of the time.
And if someone forwarded you this, the free half of every letter is the part you’re reading now. The record, the teaching and the charts go to everyone.
It lands every Sunday, Wednesday and Friday.
The board is below this line
Everything above is the method, the record and the reasoning, and it’s free on purpose. Everything below is the product: three new setups with their trigger, stop and target, last week’s seven resolved with the prices attached, the open book, and AAPL’s numbers now the stop has moved.
A closed trade can’t be front-run, which is why the whole record above is free. A live level can be, which is why it isn’t.
$29 a month, 95c a day. Or $199 for the year on the launch offer against a $249 list, which is 55c a day and saves you $149 against paying monthly. No trial, cancel anytime.
Your journal discount is 30% off with code RBT30 at rbtrading.site if you’re reading the free half. Members get 50% and it’s already applied, just use your member email, there’s nothing to type.
Every level here was written before this morning. I haven’t printed a “now” column this week because it’d be a weekend price that’s stale before you read it. Live prices, and alerts on any row, are on the Desk.